1. From Breakout Narrative to Reality Check
In my previous article from December 19, 2025, I outlined why 2026 marks the breakout phase for real-world asset (RWA) tokenization. At the time, the narrative was clear: tokenization had moved beyond experimentation and was entering production scale.
The numbers supported this shift:
- ~$30B RWAs on-chain (actuals)
- ~$9T forecast by 2030 (BCG / Chainalysis)
- Real estate among the top 3 fastest-growing segments, with projections of
👉 ~$1.4T by 2026 (Venturebloxx)
Additional industry forecasts point in the same direction:
Deloitte expects tokenized real estate to reach multi-trillion scale over the next decade
At the same time, industry narratives often reference already material market sizes — for example:
Zoniqx cites >$10B tokenized real estate in 2025, albeit without transparent methodology
The narrative is compelling – But narratives scale faster than markets.
2. A Simple Question — How Much Real Estate Is Actually Tokenized Today?
The term “tokenized” suggests something inherently transparent, traceable and measurable on a blockchain.
In reality, this assumption only partially holds.
Let’s start with what we can observe:
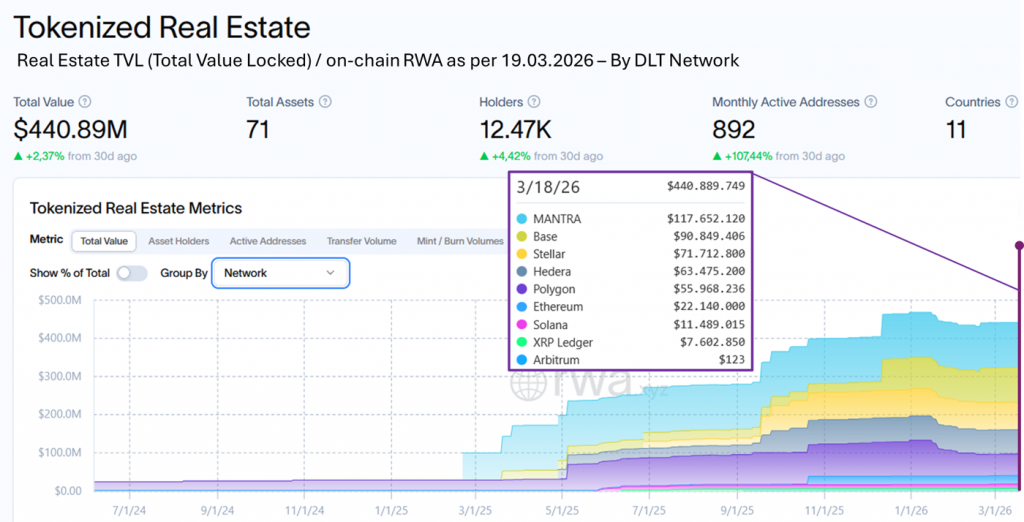
👉 ~$440M tokenized real estate on-chain (Q1 2026, RWA.xyz)
(see chart above – source: RWA.xyz)
This creates an immediate tension:
- $0.4B observable reality versus
- ~$10B commonly cited market size
Both numbers circulate in the same discussions — yet they seem fundamentally incompatible.
3. The Measurement Problem — Why Both Numbers Are “Correct”
The resolution lies in a simple but critical distinction:
Visibility ≠ existence
On-chain data captures only what is:
- publicly issued
- externally traceable
- technically indexable
Everything else — and that is most of the market — remains outside this lens.
To make sense of this, the market needs to be understood in layers:
🎯 Real Estate RWA Market Structure (Q1 2026)
🟢 On-chain (measurable / indexable)
Clarification:
Strictly speaking, “on-chain” would imply that legal ownership itself is natively represented by the token. In real estate, this is almost never the case due to land registries.
👉 Here, “on-chain / TVL” refers to publicly visible tokenized exposure, not legal title representation.
Definition:
Assets with public tokens and observable on-chain activity
Characteristics:
- Public chains (Ethereum, Polygon, Base, Stellar)
- Standardized tokens (ERC-20 etc.)
- Wallets and transfers externally visible
- Partial liquidity
Structures:
- Tokenized SPV equity
- Fractional ownership
- On-chain debt / yield products
Examples:
- RealT
- REENTAL
- Dubai (selected World Islands assets)
👉 ~$0.2B – $0.5B
🔵 Semi-on-chain (hybrid, partially visible)
Definition:
Tokens exist on-chain, but ownership and transferability are only partially observable
Characteristics:
- Custody layers (e.g. Fireblocks)
- Whitelisting / transfer restrictions
- Limited liquidity
- Investor mapping off-chain
Structures:
- Tokenized funds with restricted trading
- KYC-gated SPV equity
- institutional pilots on public chains
Examples:
- Securitize (selected real estate structures)
- U.S. private placement token offerings
- hybrid Dubai / Middle East setups
👉 Not reliably quantifiable
🔵 Off-chain dominated (not measurable / not indexable)
Definition:
Tokenization exists, but no meaningful public blockchain visibility
Characteristics:
- Custodian-held assets
- Private / permissioned systems
- SPV register as source of truth
- minimal or no on-chain activity
Structures:
- Institutional real estate funds
- private placements / club deals
- bank-driven tokenization
Examples:
- Securitize (core business)
- ADDX (Singapore)
- SDX (Switzerland)
- tZERO, BrickMark, SolidBlock
👉 Total market (incl. above): ~ $10B range
4. Resolving the Contradiction
The apparent contradiction dissolves once the layers are understood:
- On-chain data = observable surface (~$400M)
- Actual market = largely hidden (~$10B)
Tokenized does not mean observable.
This is the central misconception in today’s market discourse.
5. Reality Check on Forecasts
This perspective reframes earlier projections.
Scaling from ~$10B today to $1.4T by 2026 would require a level of adoption that is not yet visible in market structure, infrastructure, or deal flow.
👉 Near-term forecasts appear structurally overstated
The long-term thesis remains intact — but timelines matter.
6. Momentum Is Real — Even If the Numbers Lag
Despite this, the market is clearly moving.
In my day-to-day work with clients, prospects and partners, I see this shift very directly:
- I see institutional interest translating into concrete mandates
- I see increasing demand for tokenized capital formation structures
- I see more real-world implementations moving beyond pilot phase
- And most importantly, I see a clear rise in actual client projects
From an operating perspective, the shift is unmistakable:
Tokenization is no longer a concept — it is becoming repeatable business.
7. Conclusion — A Market Between Visibility and Reality
The real estate tokenization market today exists in two parallel states:
- Visible on-chain → small (~$400M)
- Economically real → significantly larger (~$10B)
Understanding this gap is critical. Because the future of tokenization will not be driven by:
- what is visible today
- or what is forecasted
But by how quickly invisible structures become scalable, standardized and integrated into capital markets.
Final takeaway:
The biggest gap in real estate tokenization is not growth — it is visibility.
And that is exactly what defines how early this market still is.